(R) Bike Share Case Study
- csgreene9
- Apr 17, 2022
- 3 min read
Updated: Apr 21, 2022
Google Certifcate Capstone Project
Catherine Greene | April 2022

Introduction: Cyclistic, a bike-share company, contains a geotracked fleet with 5,824 bicycles and 692 docking stations. For disability inclusion, this Chicago based company also offers reclining bikes, hand tricycles, and cargo bikes. Cyclistic's clientele generally rent traditional bikes with only about 8% of riders using the assistive options. Furthermore, while most bikes are used for leisure, 30% of them are used for daily work commute.
Presently, Cyclistic has flexible pricing plans in the form of single-ride passes, full-day passes, and annual memberships. Within the company, singe-ride and full-day pass customers are considered 'casual riders' whereas the annual membership customers are 'members'. Lily Moreno, Director of Marketing at Cyclistic, believes that the success of the company lies in the number of members and aims to convert 'casual riders' and maximize the number of of 'members'.
Business Task:
How do annual members and casual riders use Cyclistic bikes differently?
Time Frame:
Time Frame: Ideally one week
Start Date: April 15, 2022
End Date: April 17, 2022
Tools Used:
R and R Studio (via Jupyter Notebooks) for cleaning, manipulating, analysis, visualizations, and documentation.
About the Data:
Data has been retrieved from Coursera for use in the Google Data Analytics Capstone Project. The license agreement for the data can be found here: https://ride.divvybikes.com/data-license-agreement.
Cyclistic's historical trip data from the last 12 months (March 2021 - March 2022) was provided as .csv spreadsheets.
The data provides bike type (classical/electric/docked), start day and time, end day and time, start station name and id, end station name and id, start longitude and latitude, end longitude and latitude, and customer type (member/casual).
Copies of the files are made of each dataset as backup.
Cleaning the Data:
The data was read in via pandas and the datasets were combined vertically. The datasets each have the same 13 variables (ride_id, rideable_type, started_at, ended_at, start_station_name, start_station_id, end_station_name, end_station_id, start_lat, start_lng, end_lat, end_lng, member_casual) with varying numbers of observations. There are 0 null values in these datasets and 0 duplicate ride_id's.
Rows were added for the extracted date, month, year, day of week, and calculated length of trip. The combined dataset has 13 variables and 5,952,028 observations.
There were some negative length trips where the end date occurred before the start date so the absolute value of the length of trip was recorded. Some lengths were 0 seconds long but they were evenly distributed between members and casual customers so they remained in the final dataset.
A snapshot of the final dataset is below:

Exploratory Data Analysis
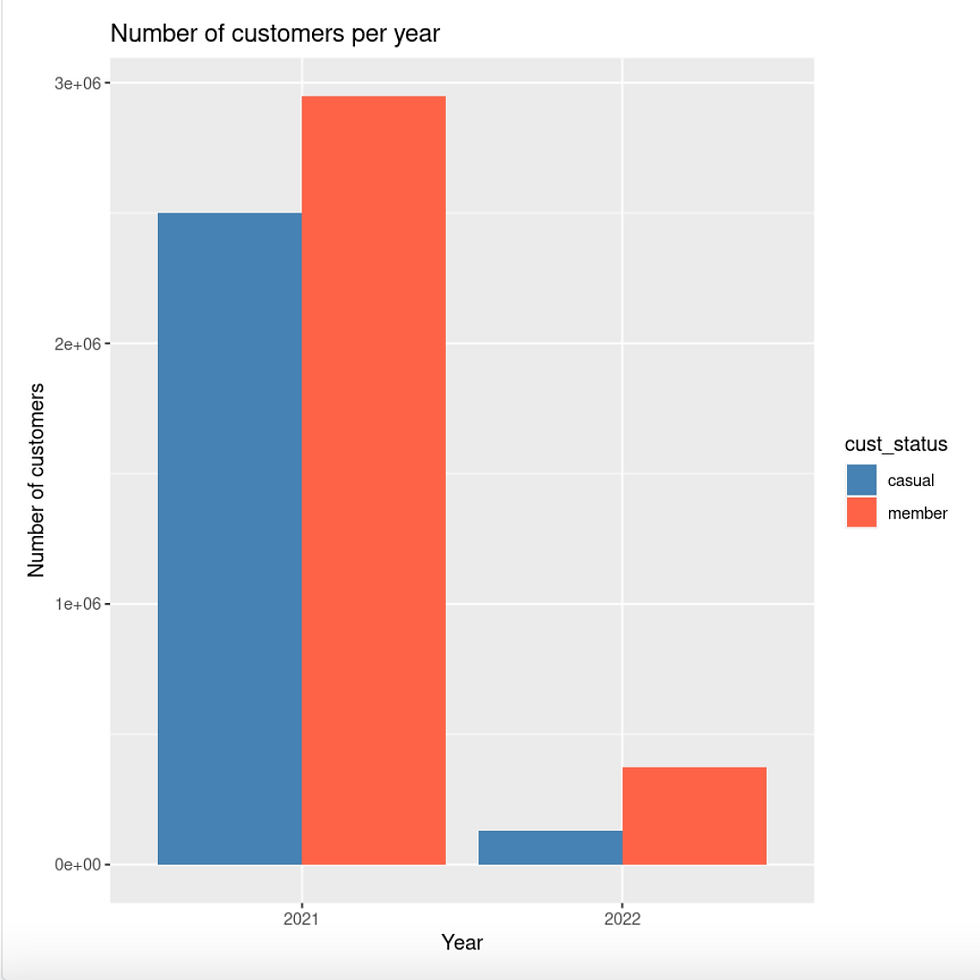
As expected, the number of members is greater than the number of casual members.

While casuals are more active during the weekend than members, members are fairly consistent throughout the week. The most active days for members tend to be Wednesdays whereas Saturdays are when casuals are most active.

Casual customers are more active during the months of June, July, August, and September (summer months) whereas members are more active in March, June, July, August, September, and October. Both customer types have a low activity level in January and February which makes sense with Chicago winter weather.
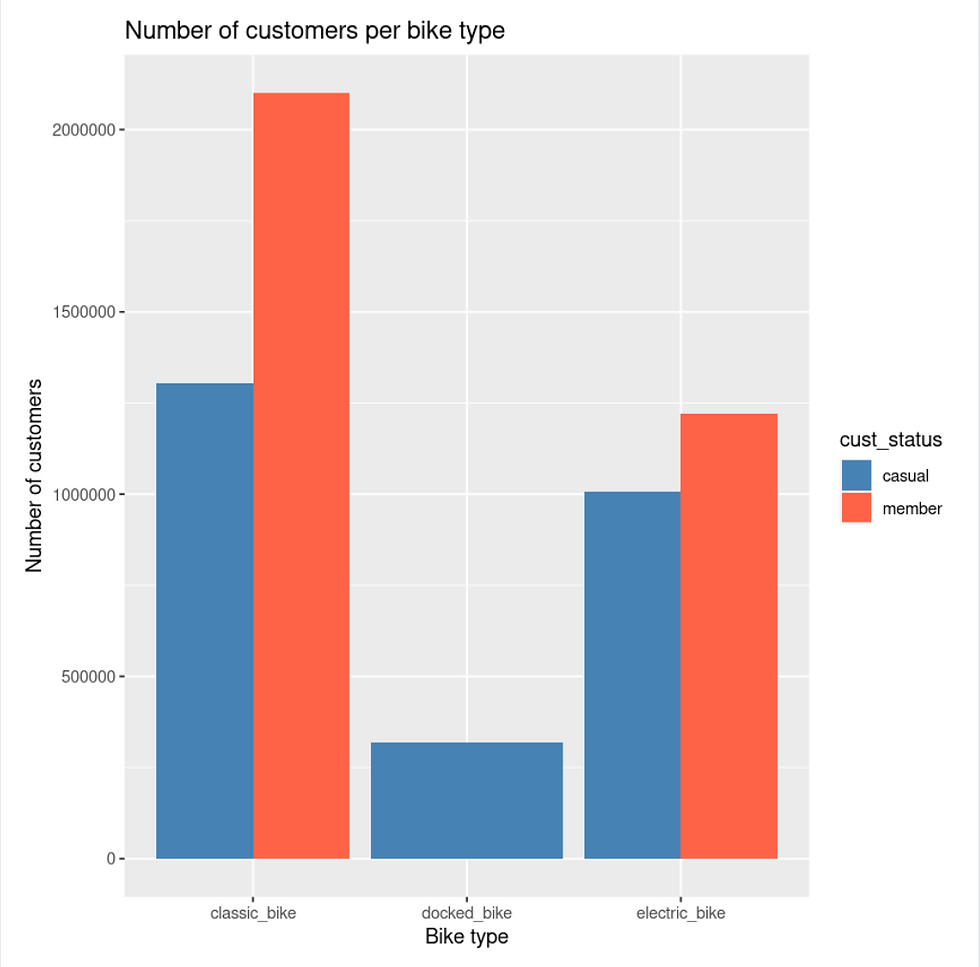
Casual and member customers both tend to favorite classic bike over the electric bike.
Summary:
Overall, members have more rides than casual customers as is expected. However, casual members have longer bike rides at almost four times the length of a member's ride. Casual customers are more active on weekends whereas members are pretty consistent throughout the week and most active on Wednesdays. Casual customers are more active during the months of June, July, August, and September (summer months) wheras members are more active March, June, July, August, September, and October. Both customers have a low activity level in January and February which makes sense with Chicago winter weather.
Recommendations:
New memberships based off of length of rides instead of annual rides would be beneficial. Casual customers are more seasonal but they have longer rides.
Limited time promotion for weekend memberships as that is when casual customers are most active.
And seasonal memberships as casual customers are fairly seasonal with most of their activity in the summer months.


Comments